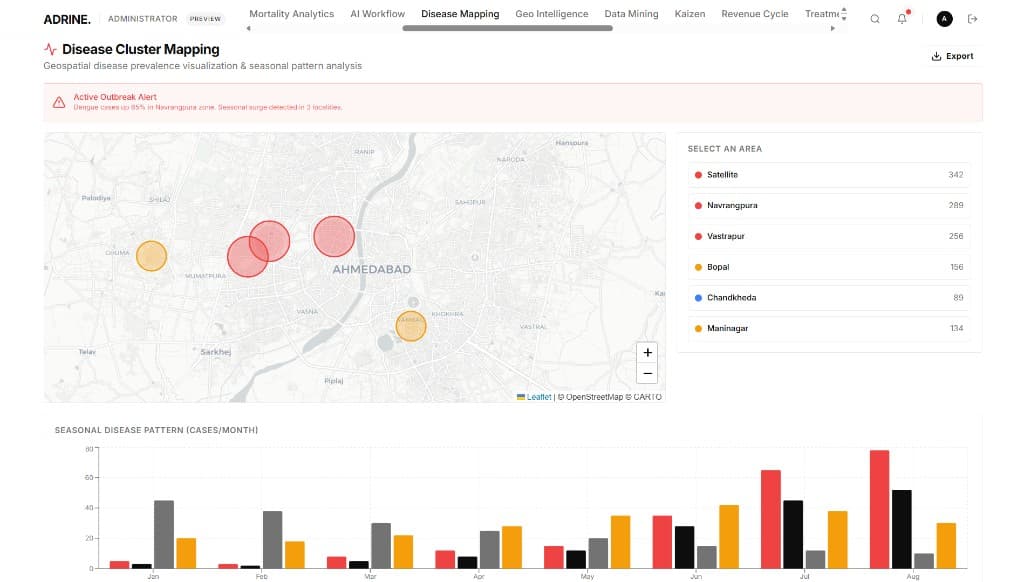
Disease Cluster Mapping
Geospatial disease prevalence visualization and seasonal outbreak patterns across your catchment.
Every department connected.
One calm system.
Platform
Live briefing, disease mapping, population analytics, and clinical outcomes — not separate tools. One operating system.
Geospatial disease prevalence visualization and seasonal outbreak patterns across your catchment.
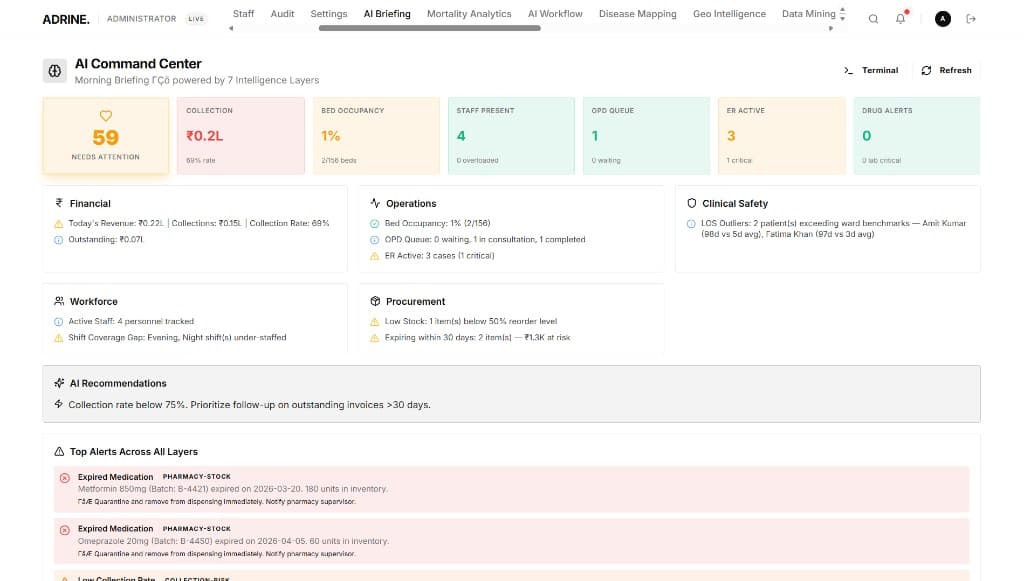
Morning command center — beds, collections, queues, and clinical alerts in one live briefing.
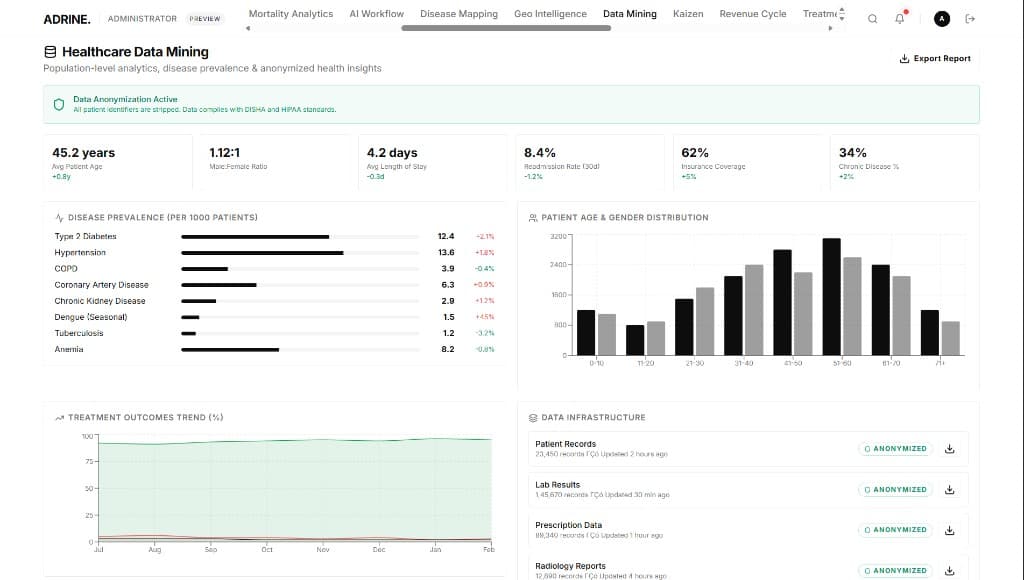
Population-level analytics, disease prevalence, and anonymized insights — DISHA & HIPAA ready.
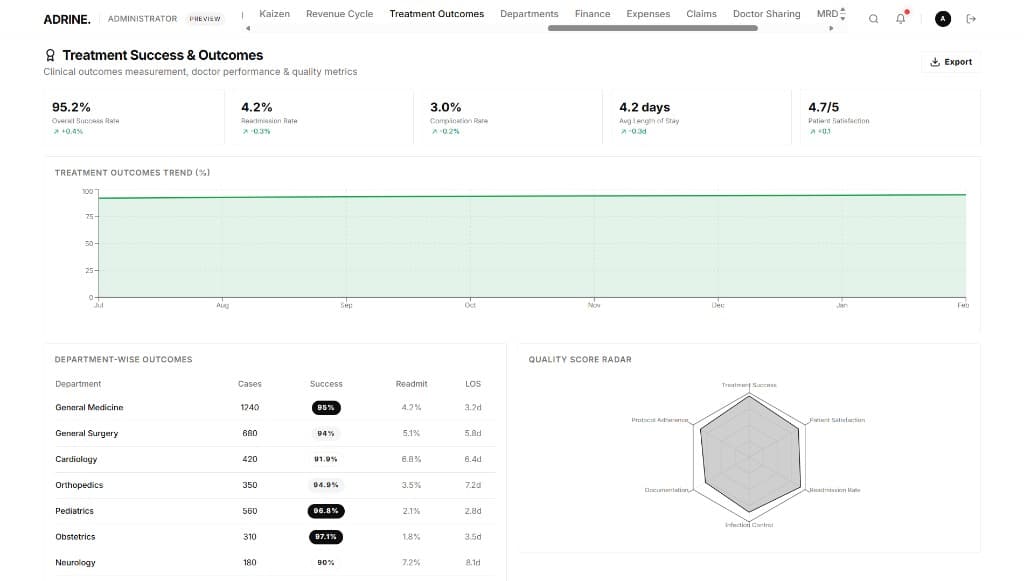
Clinical outcomes measurement, doctor performance, and department-wise quality metrics.
Intelligence
Each layer watches a different part of your hospital — finance, workforce, operations, and more. All feed one morning briefing.
Where it comes together
Collections, bed occupancy, staff, queues, and alerts — surfaced before your day starts.
Revenue leakage scans, cash forecasts, and a daily digest — no digging through reports.
Attendance anomalies, shift planning, attrition risk, and payroll integrity.
OPD load, bed forecasts, ER surges, wait-time bottlenecks, and stock-out warnings.
Catchment mapping, competitor benchmarks, and service-line opportunities.
Live collections, aging priority, pre-auth prediction, and billing error checks.
NABH outcomes, drug interactions, critical labs, and length-of-stay prediction.
Auto-reorder, expiry risk, consumption anomalies, and vendor scoring.
FAQ
Book a 30-minute demo — we'll map modules to your hospital size and departments.
Tell us your bed count and departments — we'll tailor the walkthrough.
Book a demo